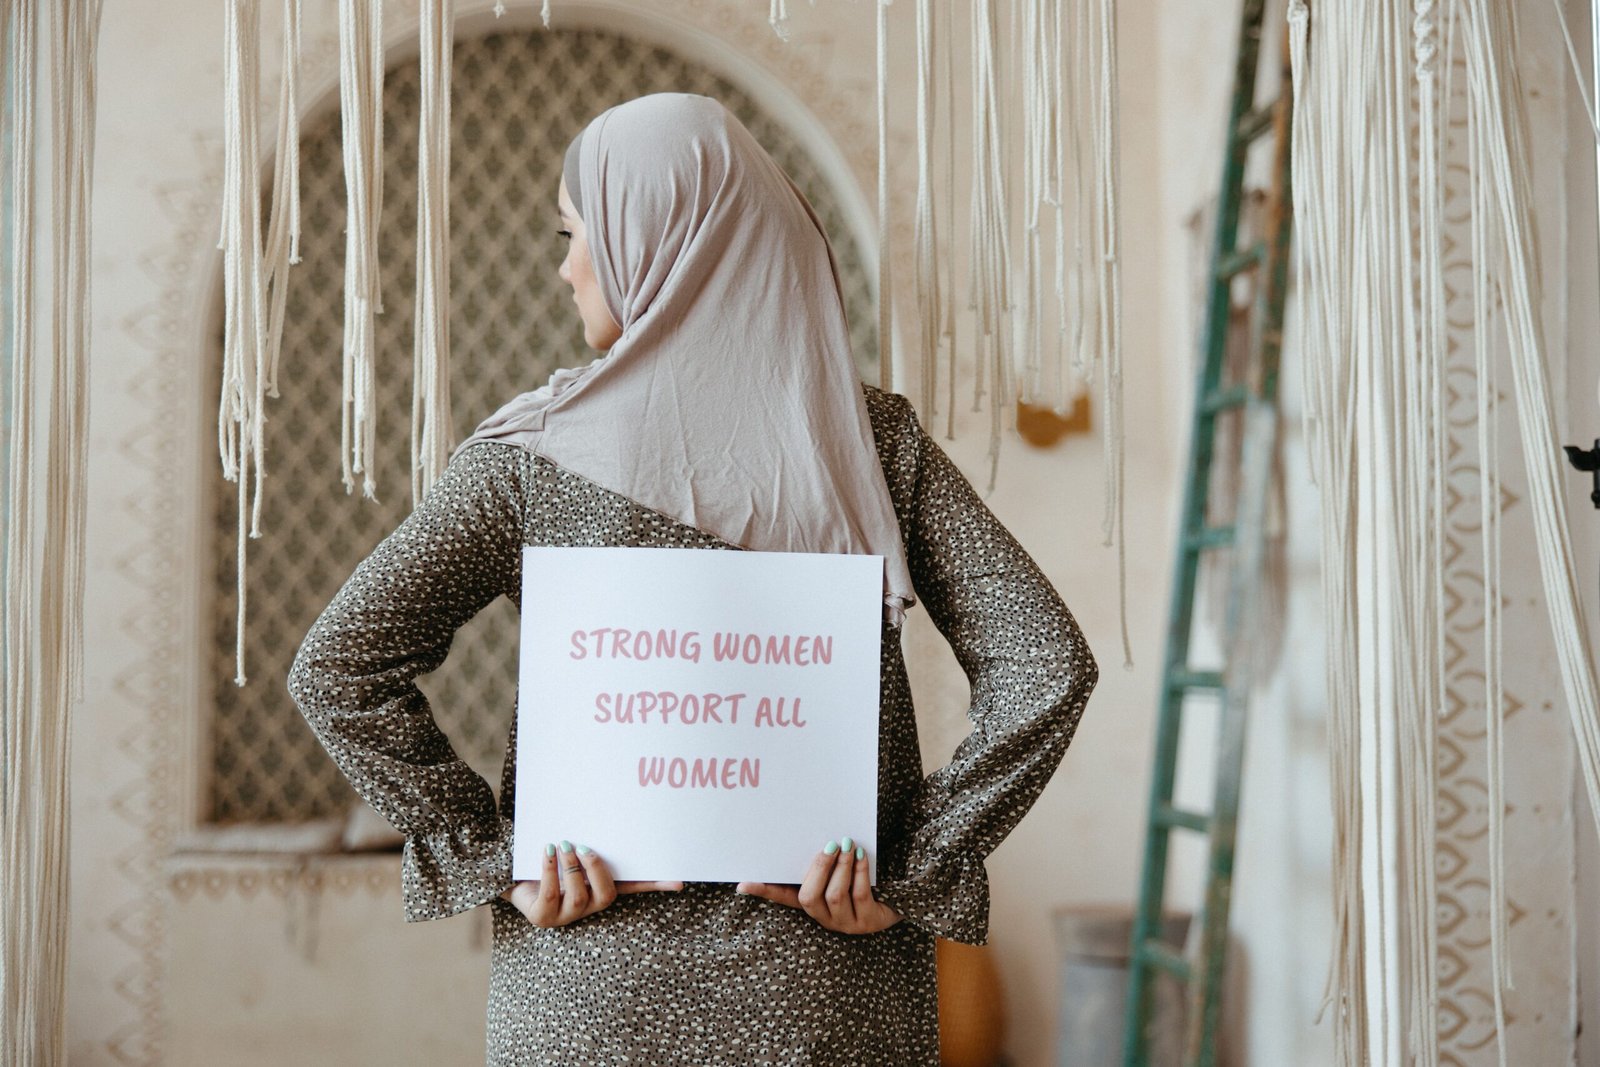

“When the rich have more children, wealth multiplies. When the poor have more children, poverty multiplies.”
I saw this statement on social media, and it has troubled me ever since. I think that the statement is simple yet surprisingly logical, which makes it dangerous. So, it raises a crucial question: does family size determine whether a person is rich or not, and if not, what factors determine wealth and poverty?
Firstly, we can observe that the statement has some validity because in almost all countries, it is common for children to inherit money and wealth from their families. Children from families that already have much will receive more than those who have little or none. Secondly, it is also notable that the number of children in one family is not the determining factor for their wealth or poverty.
Therefore, the article’s opening claim is not accurate. The rich get richer because they inherit more than money. They gain access to opportunities. And the poor get poorer because they inherit less than money. They are farther away from opportunities. However, if these assumptions are false, and the number of children in one family is the determining factor for their wealth. Then, this is the most incredible economic hypothesis in the world.
The Global Picture
The gap between the rich and poor is different all over the world. Some countries are better in terms of wealth distribution than others. Nevertheless, many countries seem to have common problems when it comes to unequal wealth distribution. According to the World Inequality Report 2026, the 10% richest households possess 53% of the global income and 75% of the global wealth. At the same time, the bottom 50% of the world’s population only receive 8% of the global income and 2% of the global wealth. Undoubtedly, the volume of income and wealth earned by each person is significant, but the main difference between rich and poor is that the wealthy can invest their income into other assets.
The different countries represent different trends in economic inequality. They show how the gap between rich and poor continues to grow.
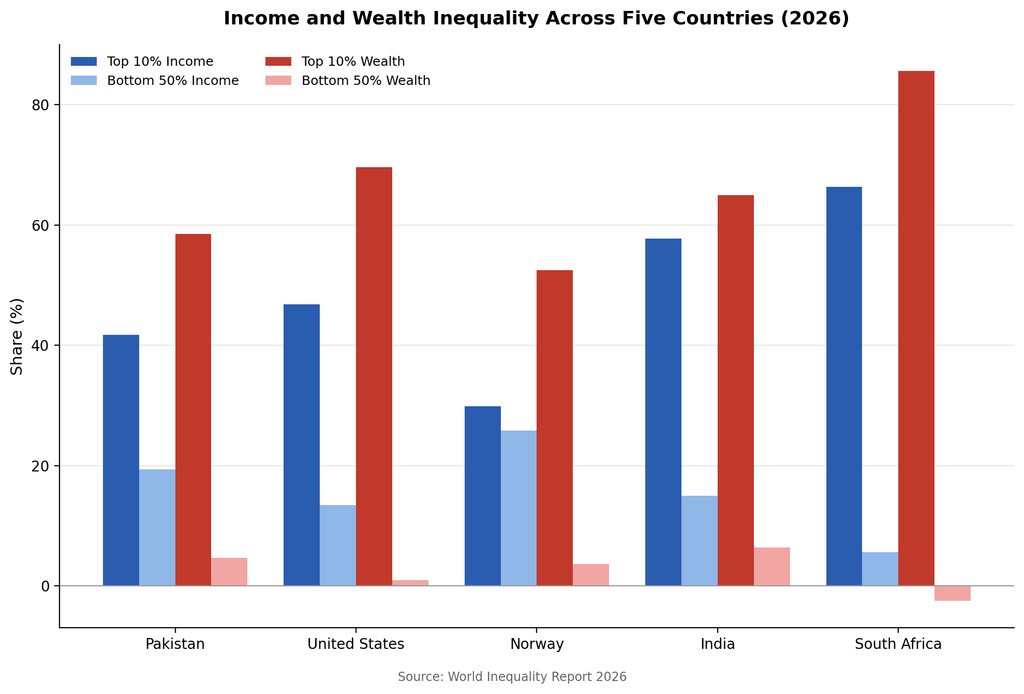
Start with Pakistan, where this conversation began: wealth here is split almost twice as unevenly as income, so families can earn a steady income and still own almost nothing. Moving to the United States, the same imbalance shows up in a country with none of Pakistan’s constraints. It proves that national wealth guarantees nothing about fairness. The bottom half of Americans hold just 1% of wealth, and the top 10% own 69% of it. Norway breaks that pattern not by eliminating inequality but by managing it. They keep their income and wealth gap close together instead of letting one run far ahead of the other. Similarly, India shows what happens when the same imbalance plays out at a scale few countries can match, with over a billion people living inside. And South Africa pushes the pattern to its extreme: the bottom half’s wealth share is not just small; it’s negative. It means the poorer half of the country collectively owes more than it owns.
Look up at the graph of these five countries and you find very little in common: different governments, different histories, different average family sizes. But one pattern still shows up in all of them: a very large share of income and wealth is concentrated in the hands of a small share of the population, while billions of people continue to live with limited resources and opportunities. If family size were a deciding factor, this pattern should look random. But it doesn’t. It looks structured.
The Great Gatsby Curve
There is a name for the pattern those countries just revealed, and economists have been mapping it for decades. It is called the Great Gatsby Curve. It demonstrates the relation between the wealth of one’s parents and the ability to move up the ladder in terms of income. The Great Gatsby Curve was first presented by Alan Krueger in his speech at the Center for American Progress in 2012. The curve was named after F. Scott Fitzgerald’s novel The Great Gatsby, published in 1925. This curve illustrates the relationship between income inequality and social mobility.
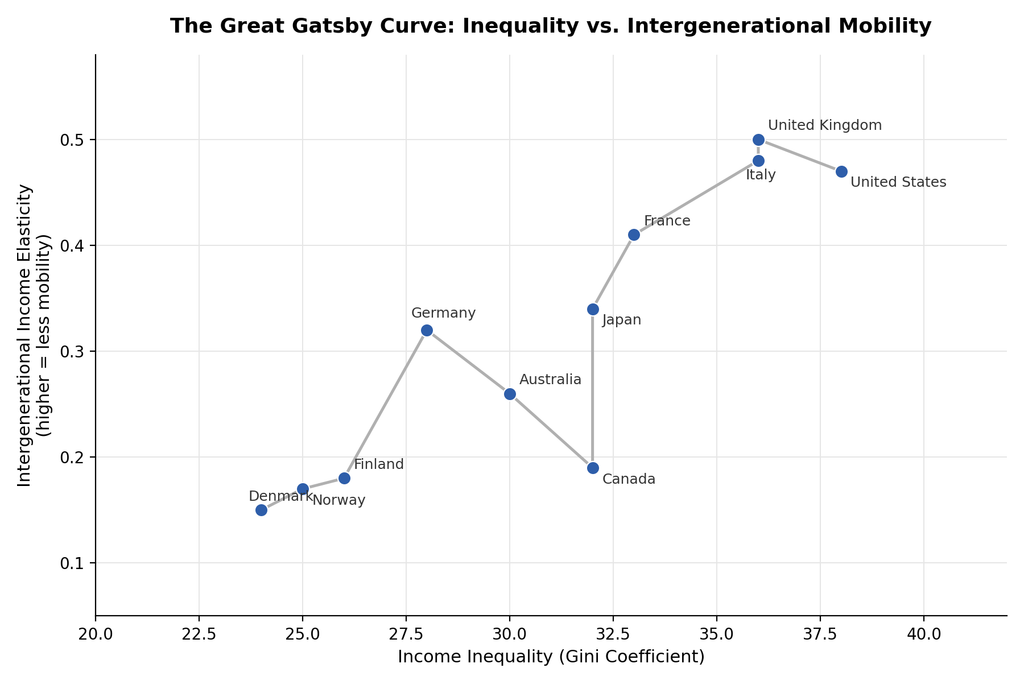
The relationship is eerily consistent. Denmark, Norway, and Finland are all low-inequality countries, clustered at the bottom left. In these countries, the ability to move up the ladder is the highest. On the other hand, the United States sits at the opposite end, nearly matching the United Kingdom and Italy. Despite its wealth, a child born poor there has almost as little chance of moving up as a child born in far less prosperous nations. Being a wealthy nation doesn’t mean wealth is shared equally.
While countries like Pakistan, India, and South Africa do not appear on this specific chart, the same logic the curve is built on still applies to them. Inequality determines who gets access to quality education and stable employment. And that access is exactly what decides mobility everywhere else the curve has been measured. So, this theory does not need new data to prove itself here. It needs only one number that is visible in a country’s high Gini score. For an average person born into those half-bottom economies, the chances of moving up are lowest in terms of income equality.
Nevertheless, the Great Gatsby curve is not complicated. The character of Jay Gatsby, the novel’s protagonist, himself rejected the idea of class inequality and represented the view that people can climb up the social and economic ladder regardless of their background. The curve demonstrates a tendency that has existed for a long time and still exists today.
Therefore, the initial statement is incorrect because the number of children in one family does not determine the wealth or poverty of that family. Children are born into families that have much or little.
If family size decided the future, the curve would follow the birth rate instead of inequality. It doesn’t. Countries like Norway have small families and high mobility. Meanwhile, countries with far higher birth rates than Norway don’t automatically end up with less mobility either; they end up with less mobility only where inequality is high. Take South Africa, where a family has two or six children; the outcome barely changes, because the economy around them was already setting the ceiling on their mobility, not the number of people in their home. A child’s future is shaped by their country’s level of inequality long before anyone thinks to count how many siblings they have. That is why the famous saying “the poor get poorer, and the rich get richer” actually makes sense in terms of economic inequality.
How the Rich stay Rich, the Poor stay Poor
Once you strip away the theory, the mechanism is almost mechanical. Money that already exists tends to grow on its own. Money that doesn’t exist yet has to be earned, all over again, every single month.
A wealthy family’s money just rarely sits still. It is in property that appreciates, stocks that pay dividends, a business that compounds year over year. Even if you do nothing, that wealth tends to grow. Economist Thomas Piketty has described this process clearly, demonstrating that returns on capital have consistently grown faster than wages. In plain terms, owning things has paid off faster than working for things, for most of modern economic history.
Meanwhile, a poor family’s money works differently. Income arrives, and it leaves almost immediately: used for rent, food, transport, a medical bill that can’t wait. There is rarely anything leftover to turn into an asset. And when something goes wrong, like a job lost, an illness, a bad harvest, there is no cushion to absorb it. The shortfall often turns into debt. Debt, unlike wealth, also compounds. It grows quietly in the background, the same way an investment does, but in the opposite direction.
This is the part that the original claim gets backward. It is not that rich families have fewer children and poor families have more. Instead, it is that one family’s wealth multiplies whether they add it or not, and another family’s shortfall multiplies the same way. A rich household with three children still has assets, a business, and a property to divide between them. A poor household with three children has to split whatever exists, often not enough to begin with, into equal parts, some of it into debt they didn’t create.
However, the gap is not maintained by the choices made in the delivery room. It is maintained by what already existed in the bank account, the land deed, or the loan file, long before any child is born into either family.
Mindset Angle
There is a popular idea that rich people think in terms of investment and opportunity, while poor people think in terms of survival and scarcity, and that the difference in thinking is what keeps each group where it is. This idea is appealing because it feels actionable: change your mindset, change your outcome. But it also quietly shifts the blame onto the people with the least power to fix the problem.
Research on scarcity offers a more honest version of this idea. Economist Sendhil Mullainathan and psychologist Eldar Shafir studied how financial pressure affects decision-making. They found something counterintuitive: it is not that poor people think differently by nature. It is that scarcity itself narrows how anyone thinks. When a person is dealing with an unpaid bill or overdue rent, their mental bandwidth gets pulled entirely into managing that one crisis. Long-term planning, patience, even basic decision-making all suffer, not because of who the person is, but because of what they are dealing with.
Put a financially comfortable person under the same pressure and their decision-making narrows the same way. The mindset is not the cause of poverty. It is what poverty does to a mind, temporarily and often reversibly, once the pressure lifts.
Similarly, this matters for the fertility claim too. A family with more children and fewer resources is not making worse decisions because of some fixed poor mindset. They are making decisions under high pressure. A wealthier family with the same number of children would never face it in the first place.
Culture of Poverty
A similar argument was made in the 1950s and 1960s by the anthropologist Oscar Lewis, who studied the poor families in Mexico and Puerto Rico and concluded that poverty persists because of so-called poverty culture. According to Lewis, poor families tend to pass on certain attitudes and behaviours to their children, which in turn lead to their continued impoverishment. In other words, the poor are poor because they were raised to be poor. Decades later, his theories formed the basis of what became known as the “culture of poverty” hypothesis. This applied to poor black families, both in the United States and around the world.
However, Lewis himself did not believe that a culture of poverty was an innate characteristic of poor people. He saw this culture as a response to structural economic conditions that accounted for the lack of opportunities, which in turn caused the development of poverty culture among these families. He concluded that both culture and structure contributed to poverty, although to different degrees.
Meanwhile, sociologist William Julius Wilson directly challenged the poverty culture theory. In his research on impoverished neighbourhoods in America, he argued that it was not a poverty culture that kept poor communities poor, but it was the erosion of the job market in these areas that led to the breakdown of families. The patterns people associated with a “poverty culture” showed up as a result, not a cause. In contrast, he suggested that the restoration of employment prospects in these areas would alleviate the circumstances.
When it comes to the fertility claim, the debate cuts the same way. A family’s habits around money, work, and planning are not fixed traits passed down like an heirloom. They are shaped by whatever economic structure surrounds them, generation after generation. Family size was never the driving force behind this structure. It was only ever a result of them.
The Verdict: Weighting the Evidence
Three explanations have been on the table: broken systems, inherited culture, and mindset. Not all of these carry the same weight.
A structural explanation accounts for the best evidence. The Great Gatsby curve, the country data, the wealth and income gaps; all of it points to the same conclusion: mobility tracks inequality, not birth rate. Norway did not build high mobility by having fewer children. It built it by taxing wealth, funding public education equally, and keeping the gap between rich and poor manageable. That’s the policy choice, not a fertility outcome. And it shows up the same way country after country.
Culture of poverty explains something real but only part of the story, and even that part is debated. Habits do get passed down inside poor households, the same way they do inside the wealthy ones. But Wilson’s research suggests those habits are usually a response to a structure that already failed, not the reason it failed in the first place. Culture explains how poverty persists once it exists. It doesn’t explain how poverty started.
Meanwhile, Mindset is the weakest of the three, standing alone. Scarcity research shows that what seems like a fixed mindset is often just what pressure does to anyone’s thinking, whether rich or poor. It can be lifted when pressure is removed. It is useful to understand but not a cause by itself.
Putting this all together, a simple order emerges. Structure creates the gap. Culture keeps it steady across generations, once the gap already exists. Mindset is just what living inside that gap looks like, from the inside.
However, this brings the argument back to where it started. When the rich have more children, wealth multiplies. When the poor have more children, poverty multiplies. It sounded like a statement about family size at first. It was never really about family size at all. It was always about what a family already had, or didn’t have, long before any child was born into it. A country’s economy had already decided which direction that multiplication would go.
Author:
Malaika Bashir